Child maltreatment: Understanding national and state-level trends
Child Trends recently released three sets of child welfare fact sheets detailing child maltreatment,[1] foster care,[2] and adoption statistics from federal fiscal year (FFY) 2013. Each set of 52 fact sheets uses state and national data to tell a story about our nation’s most vulnerable children and youth, a story that varies dramatically by state. In this blog we share some background and general findings about national trends. Of course, we encourage you to take a closer look at your state’s fact sheets.
In FFY 2013, over 3 million children were the subjects of an investigation or assessment for abuse or neglect, and over 675,000 children were found to be victims of maltreatment. [inlinetweet prefix=”” tweeter=”” suffix=”per @ChildTrends”]Nationally, neglect is the most commonly substantiated form of child maltreatment.[/inlinetweet] Almost 80 percent of victims were neglected. Definitions for neglect vary by state and can be based on anything from having inadequate child care, to failure to enroll a child in school, to a parent’s substance abuse and/or addiction.
What happens to these kids?
After maltreatment has been substantiated, the child may either receive in-home or out-of-home services. In-home services deliver support and oversight to families while the child remains in the home. Children who receive out-of-home services are removed from their home and placed either with a relative or in foster care. Nationally, two thirds of child maltreatment victims receive in-home services while the remainder are removed from their homes. However, these rates vary greatly between states: in-home service rates ranged from 9 to 94 percent of all maltreatment cases.
Children removed from their home typically enter foster care. [inlinetweet prefix=”” tweeter=”” suffix=”per @ChildTrends”]In FFY 2013, over 640,000 children spent at least one day in foster care[/inlinetweet]. On average, these children spent 22 months in care, however, almost 8 percent were in care for over 5 years. Of the nearly 240,000 children who exited care in FFY 2013, 51 percent returned to their parents, 10 percent aged out, 16 percent left to live with relatives, and 21 percent were adopted.
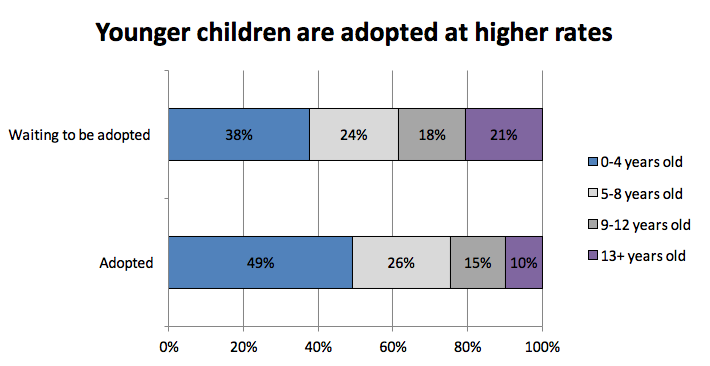
When it’s determined that a child cannot be reunited with parents, the parents’ rights must be terminated and the child is considered legally free for adoption. In FFY 2013, over 50,000 children were adopted from foster care. The majority were adopted by a non-relative foster parent (53 percent), and a substantial number were adopted by relatives (31 percent). An additional 100,000 children in foster care were waiting to be adopted. [inlinetweet prefix=”” tweeter=”” suffix=”per @ChildTrends”]On average, children adopted were younger than those waiting for adoption[/inlinetweet].
Having state-specific data is important
Having state and national child welfare data allows us to make comparisons and identify trends that might otherwise be missed. For example, the adoption fact sheets show clear age disparities between children who’ve been adopted and those left waiting. Children aged 13 and up account for only 10 percent of children adopted, and are 21 percent of children waiting.
How can I learn more?
Check out the fact sheet for your state! [inlinetweet prefix=”” tweeter=”” suffix=”per @ChildTrends”]Know what the data says about child maltreatment, foster care, and adoption where you live[/inlinetweet].
Learn about your state’s child welfare funding by reading this report on child welfare financing nationally and by state, and this brief on how and why states make the decisions they do, when it comes to funding child welfare activities.
Read more about Child Trends’ work on child welfare issues here.
[1] The information found in the Child Maltreatment fact sheets is from the federal National Child Abuse and Neglect Data System (NCANDS), and represents the federal fiscal year 2013 reporting period (October 1, 2012 – September 30, 2013). Data are publicly available in Child Maltreatment 2013, (U.S. Department of Health and Human Services, Administration for Children and Families, Administration on Children, Youth and Families, Children’s Bureau. (2015).
[2]The information found in the Adoption and Foster Care fact sheets is from the federal Adoption and Foster Care Analysis and Reporting System (AFCARS), and represents the federal fiscal year 2013 reporting period (October 1, 2012 – September 30, 2013).
© Copyright 2024 ChildTrendsPrivacy Statement
Newsletter SignupLinkedInYouTube
