
Lessons From a Historic Decline in Child Poverty
Chapter 3. The Role of the Social Safety Net in Protecting Children from Poverty
In this chapter, we seek to understand the role of the federal social safety net in the decline in child poverty from 1993 to 2019.
The social safety net is a compilation of anti-poverty programs that work to protect children from poverty. We examine the social safety net as a whole, as well as individual safety net programs that research has found to be most effective in protecting children from poverty. For both the safety net in its entirety and for individual programs, we examine how much they each contributed to the decline in child poverty, as well as how their relative roles in protecting children from poverty changed during this period. The programs examined individually include the Earned Income Tax Credit (EITC), the Supplemental Nutrition Assistance Program (SNAP), Social Security, housing assistance, unemployment insurance, Supplemental Security Income (SSI), Temporary Assistance for Needy Families (TANF, formerly known as Aid for Families with Dependent Children, or AFDC), and a handful of other, smaller federal programs.
Except for state taxes, this analysis focuses on the role of federal anti-poverty programs and does not consider the role of state or local programs or community supports (e.g., the local food bank). It does include federal programs that are administered by states, such as TANF. We exclude programs that are generally considered outside the core social safety net programs (such as bail policies) that, while peripheral to poverty, certainly influence poverty.
To determine the role of each anti-poverty program in reducing child poverty, we calculate the degree to which child poverty—as measured by the Supplemental Poverty Measure (SPM)—decreased with the resources provided by each program, following the method used by the United States Census Bureau. (For more on our methodology, see the text box below and our Methodology chapter.) We present results starting in 1980 to provide context for the steady decline in child poverty that began in 1993, but we focus our attention on 1993 to 2019 to better understand which factors most likely contributed to the extraordinary decline over the period.
We take a broad, high-level view of the social safety net’s role in reducing child poverty for the full population of children in the United States. Taking this high-level view does not allow us to investigate the nuances of the programs that make up the social safety net or to look deeply into the details of their operations (e.g., benefits cliffs, administrative burden), which has been the focus of previous scholarship. (For recent examples, see work by Herd & Moynihan, the Prenatal-to-3 Policy Center, Hoynes, and Anderson et al.) This high-level approach, however, does allow us to assess the relative role that each program has separately and collectively played in the decline of child poverty over the past quarter century.
What’s in this chapter: In Section 1, we provide an overview of the social safety net, with specific context on public tax and transfer programs aimed at reducing child poverty and the ways in which the social safety net changed from 1993 to 2019. In Section 2, we first describe the role of the entire social safety net in protecting children from poverty from 1980 to 2019; second, we examine the role of each program individually; and third, we examine the interplay among multiple policies in the social safety net in protecting children from poverty. In Section 3, we repeat this exercise for deep poverty (less than 50% of the SPM threshold), which is especially detrimental to child well-being and linked to poorer outcomes later in life. In Section 4, we conclude with a summary and discussion of overarching themes from the chapter’s findings.
No time to read Chapter 3? Read this instead.
Research parameters to keep in mind
Overall: We examine the total role of the social safety net.
More specifically:
-
- We examine the EITC, SNAP, Social Security, housing assistance, unemployment insurance, SSI, TANF, and other federal programs.
- We examine the role of individual programs additively, as well as their cumulative role together.
Time frame examined: From 1993-2019, plus 1980-1992 for historical context.
Poverty levels examined:
-
- Poverty (<100% of the Supplemental Poverty Measure threshold)
- In 2019, income less than approximately $28,881 for a two-adult, two-child household that rents
- Deep poverty (<50% of the Supplemental Poverty Measure threshold)
- In 2019, income less than approximately $14,440 for a two-adult, two-child household that rents
- Poverty (<100% of the Supplemental Poverty Measure threshold)
Key findings
The social safety net played a dramatically increased role in protecting children from poverty in 2019, compared to 1993.
-
- In 1993, the social safety net reduced child poverty by 9 percent and protected 2 million children from poverty. By 2019, the social safety net’s role in protecting children from poverty had expanded such that it reduced child poverty by 44 percent and protected 6.5 million children from poverty.
- The role of housing subsidies and the potential role of the EITC increased the most from 1993 to 2019 as contributors to protecting children from poverty, although housing subsidies contributed only modestly to the reduction in child poverty.
- The role of AFDC/TANF in protecting children from poverty—especially deep poverty—declined dramatically from 1993 to 2019. While it was once a major player in protecting children from poverty, TANF now plays a minimal role.
- In 2019, the EITC, Social Security, and SNAP contributed the most to child poverty reduction.
The social safety net also plays an important role in protecting children from living in deep poverty. However, its role in reducing deep poverty did not grow by nearly as much as its growth in protecting children from poverty; therefore, the safety net contributed little to the decline in deep poverty from 1993 to 2019.
-
- The social safety net has consistently been a hugely important protector of children against deep poverty, reducing child deep poverty by about two thirds in both 1993 and 2019.
- While the role of the social safety net increased dramatically in protecting children from poverty from 1993 to 2019, its role in protecting children from deep poverty remained fairly stable.
- In 1993, a single program may have been enough to pull a child out of deep poverty; in 2019, however, a combination of benefits across multiple programs was often necessary to lift a child out of deep poverty.
Section 1: An overview of the U.S. social safety net
The social safety net is a compilation of public anti-poverty programs that work to protect children from experiencing the negative effects of poverty. The anti-poverty programs that make up the social safety net operate by either 1) preventing children from living in poverty in the first place by transferring money directly to individuals with cash transfers and refundable tax credits; or 2) combatting the effects of low incomes with in-kind transfers that provide direct services or vouchers that low-income families can use to meet specific needs such as nutrition, housing, medical insurance, or child care.
The social safety net’s disparate programs include refundable tax credits that operate through the tax system, such as the EITC and the Child Tax Credit (CTC), as well as standalone programs that include SNAP, Social Security, housing assistance, unemployment insurance, SSI, TANF, child care subsidies, and Medicaid.[1]
Anti-poverty programs can aim to support families in the short term by providing stability in their access to basic needs during periods of economic hardship. Programs can also try to position families for long-term economic stability and mobility by freeing up resources to support parents’ labor market participation and access to higher-wage jobs, including the cost of child care, transportation, and educational and skills investments.
Several programs—such as Social Security and unemployment insurance—were not designed to provide support specifically to low-income families with children but, nonetheless, provide support to millions of children in families who experience either temporary loss of income due to involuntary parental unemployment or more chronic loss of income due to the death, disability, or retirement of a caregiver. We therefore include them in our definition of the social safety net. (For a summary of the main public programs aimed at reducing child poverty in the United States, see our resource.)
Major shifts in the safety net, 1993 to 2019
There were three major shifts in the social safety net during our study period that collectively shaped access to programs, the generosity of benefits offered, and, ultimately, their effectiveness at lifting children out of poverty. (We detail these many changes as context for the reader in Tables 3.1 and 3.2 below.)
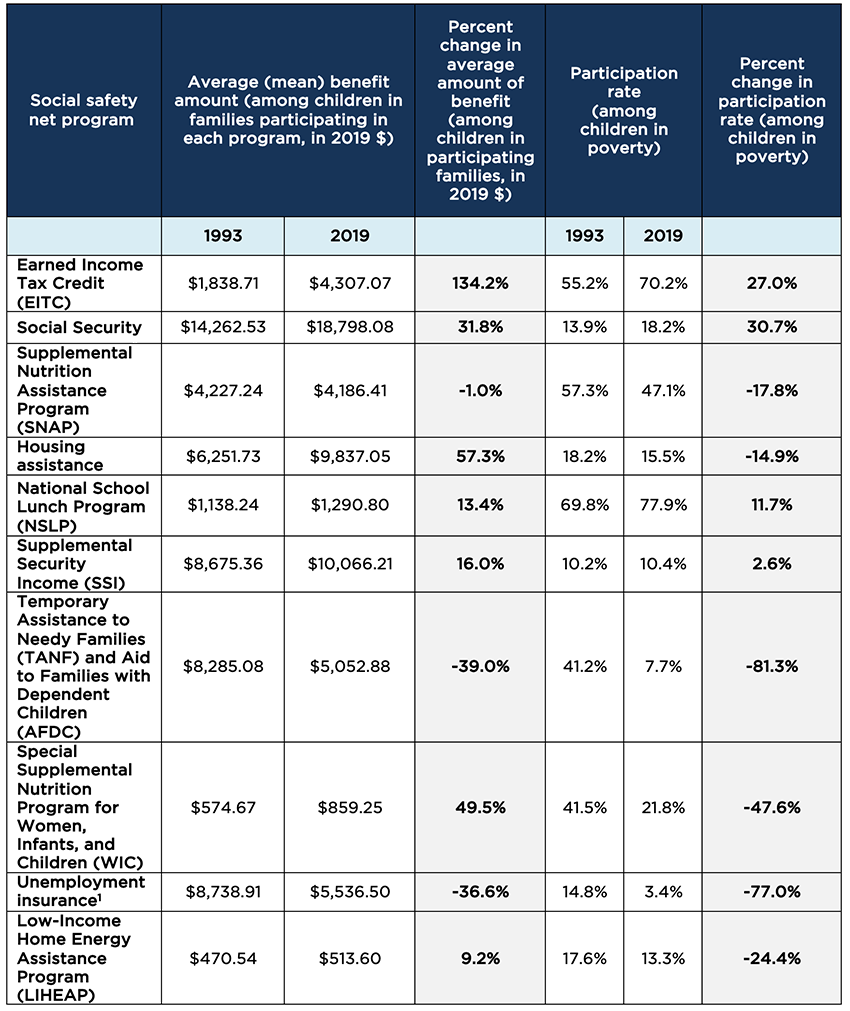
The first major shift: Spending on the social safety net broadly increased from the 1990s through the end of the Great Recession, and increases in spending frequently translated into more generous benefits and/or broader program reach (see Table 3.2). For example, federal spending for the EITC grew by more than 150 percent from 1993 to 2019; this was then reflected as an increase in the average benefit among children in participating families, and in the participation rate among children in poverty across this period. Spending on other refundable tax credits (e.g., the Child Tax Credit), housing assistance, Social Security, SSI, and SNAP also increased from the 1990s through the Great Recession. Increased spending on some of these programs may not all go toward children living in poverty, however. For example, the proportion of SNAP beneficiaries without children or above the poverty line increased from 2007 to 2015. [2] The exception to this trend of increased spending and broadening programming (in terms of benefits and/or reach) is TANF/AFDC. TANF spending on cash assistance decreased (by 71%) from 1997 to 2016, as did the average benefit amount for children, and program reach also declined from 1993 to 2019.
Second, the social safety net transitioned in the early- to mid-1990s from an emphasis on out-of-work assistance toward a focus on in-work programs aimed at a broader group of families. In-work programs include both 1) programs that require recipients to work or engage in work-related activities to maintain benefits, and 2) programs that are conditioned on work or that promote work by increasing benefits with each additional dollar earned. In the early 1990s, in the context of growing interest in welfare reform, many states increasingly took advantage of federal waivers that allowed states to implement work requirements for recipients of cash welfare programs and impose time limits, family caps, and immigrant restrictions. By 1995, 40 states had established work requirements and, one year later, in 1996, these work requirements were federally mandated by the enactment of the Personal Responsibility and Work Opportunity Reconciliation Act (PRWORA). With this shift, many programs were no longer strictly limited to families with very low incomes. Around the same time, work-conditioned programs like the EITC, which provide income support to low- and moderate-income working families with children, were expanded.
Third and finally, fundamental changes to immigrant eligibility criteria disqualified individuals or reduced benefits based on immigration status. Legal residency requirements were first included in social safety net programs in the 1970s following a sharp rise in immigration from Latin America and Asia after the 1965 Immigration and Nationality Act. In 1996, PRWORA introduced an additional eligibility criteria for the social safety net: the need to be a “qualified immigrant,” which includes those with permanent legal status in the United States (also known as green card holders). PRWORA required that immigrants hold a qualified status for at least five years before they could become eligible for social programs. This provision is known as the five-year bar.
When it comes to program eligibility, immigration status and legality can be thought of as a continuum, and programs vary in their requirements of legal status in the United States. For some programs (e.g., SNAP), children can receive benefits if they are eligible even if their parents are not considered qualified based on their legal status in the United States. However, the benefit amount a family receives is based on the percentage of qualified immigrants in the household. Consequently, citizen children and qualified immigrant children in families with non-qualified immigrant members may not receive benefits or receive lower benefits than their peers in all-citizen families. In addition, with the passage of PRWORA, all family members were required to have a Social Security number to be eligible for the EITC. More discussion on the implications of immigrant eligibility criteria can be found in Chapter 4.
Together, these three shifts extended the reach of the social safety net to low- and even moderate-income families, but also made a child’s access to benefits from the social safety net more conditional on parents’ characteristics—and especially on their work and legal status in the United States. (We will discuss in Chapter 4 how these policy shifts impact which children have more access to the social safety net and who may be left behind.)
Table 3.1. Major Policy Changes in Social Safety Net Programs, 1993-2019
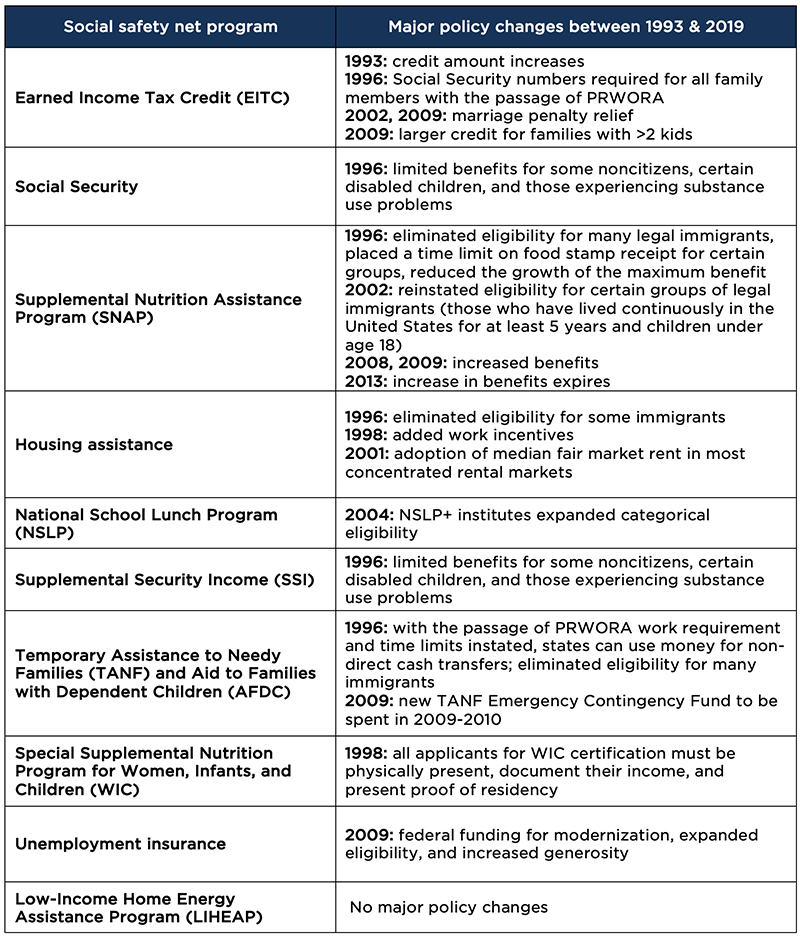
Table 3.2. Generosity and Reach of Social Safety Net Programs, and Their Change Over Time, 1993-2019
Section 2: The role of the social safety net in reducing poverty among children
Our analyses show that the role of the social safety net in protecting children from poverty dramatically increased from 1993 to 2019. This decline in child poverty was contemporaneous with an increase in national spending on social safety net programs.
Figure 3.1 illustrates the role of the safety net in protecting children from poverty quite starkly. The dark blue line shows child poverty rates, as measured by the SPM, steadily declining from 1993 to 2019. The magenta line shows what poverty rates would have been without the social safety net: Rates would have also declined during this period, but to a lesser extent and more in line with economic cycles. The growing gap between the two lines illustrates the growing role of the social safety net in protecting children from poverty.
Figure 3.1. Child Poverty Rates Based on the Supplemental Poverty Measure (SPM), Calculated With and Without the Social Safety Net, 1980-2019
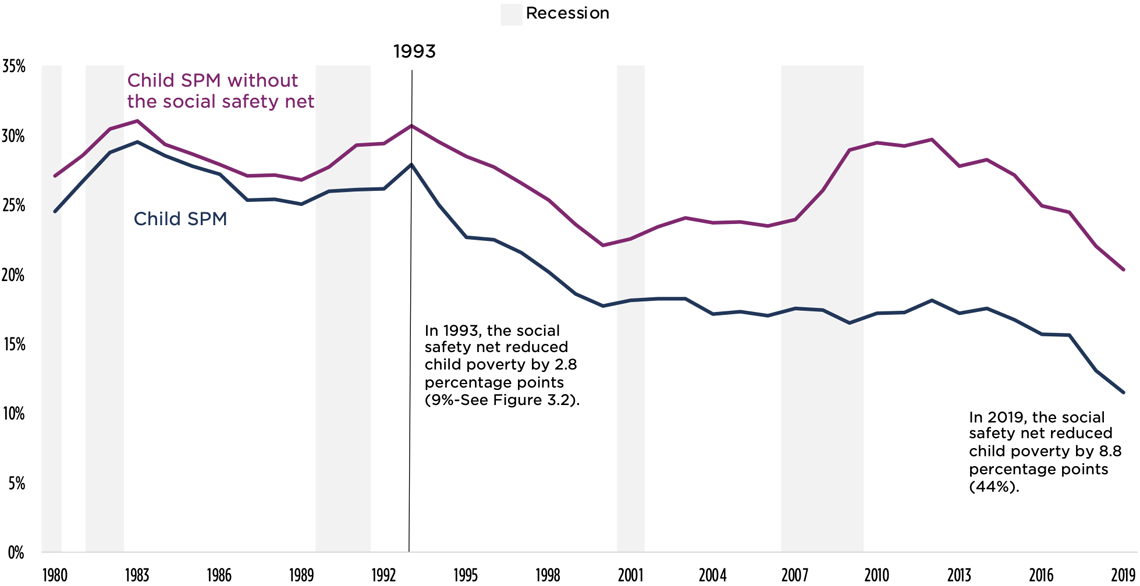
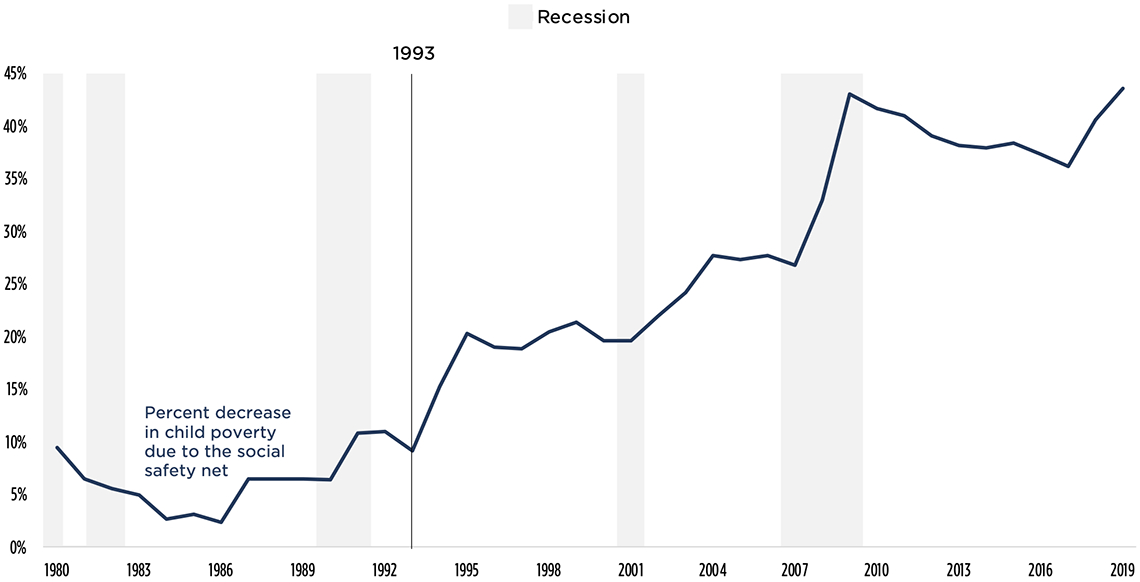
In 1993, the child poverty rate would have been 31 percent without the safety net (in magenta), compared to 28 percent with it (in blue). The social safety net lowered child poverty rates by 2.8 percentage points—a decrease of 9 percent (see Figure 3.2).
By 2019, the social safety net grew such that it lowered child poverty rates by 8.8 percentage points (from 20% to 11%)—a decrease of 44 percent. The number of children protected from poverty by the social safety net increased correspondingly: The social safety net protected 2.0 million children from poverty in 1993, compared to 6.5 million children in 2019. The number of children protected by the social safety net more than tripled from 1993 to 2019.
Figure 3.2. Percent Decrease in Child Poverty Due to the Social Safety Net, 1980-2019
While reductions in child poverty are indeed a success, we must also consider how far above the poverty line the social safety net is able to lift children. As shown in Table 3.3, in both 1993 and 2019, children in poverty who were lifted above the poverty threshold by the social safety net tended, on average, to have resources equivalent to about 130 percent of the threshold (or an income-to-needs ratio of 1.3). For example, the 2019 poverty threshold for a two-adult, two-child household that rents is approximately $28,881. The average family lifted out of poverty by the social safety net in 2019 had an income of $18,773 before the social safety net (or an income-to-needs ratio of 0.65). After including the cash value of social safety net benefits, this average family would have $37,256 in resources (or an income-to-needs ratio of 1.29).
The average family lifted out of poverty by the social safety net in 1993 tended to have an income-to-needs ratio similar to 2019 after accounting for the cash value of social safety net benefits. However, the income-to-needs ratio of children before accounting for social safety net benefits was lower in 1993 than in 2019. In other words, in 2019, the social safety net was more likely to lift children out of poverty who were closer to the threshold to begin with and who needed less of a boost to get across the line. By comparison, in 1993, the social safety net tended to lift children out of poverty who were, on average, closer to the deep poverty threshold.
Table 3.3. Mean Income-to-Needs Ratios Without and With the Social Safety Net, Among Children Lifted out of Poverty by the Social Safety Net, 1993 & 2019

Roles of individual social safety net programs in reducing child poverty
Given this evidence that the social safety net has played a growing role in reducing child poverty over the past quarter century, we turn to the relative roles of the individual anti-poverty programs that make up the social safety net. We focus on the federal anti-poverty programs that offer cash or in-kind assistance listed in Table 3.1: the EITC, SNAP, Social Security, housing assistance, unemployment insurance, SSI, AFDC/TANF, NSLP, WIC, and LIHEAP. Due to data limitations, we do not examine the role of Medicaid, child care subsidies, or the CTC, which are also intended to prevent children from being in poverty (see Methodology chapter).
Figure 3.3 below illustrates the relative role of each program in protecting children from poverty from 1980 to 2019. We include data from 1980 to 1992 as context for the decline in child poverty from 1993 to 2019. In this figure, the y axis represents the child poverty rate, as measured by the SPM, that would occur without each program, independent of other factors and considered cumulatively. That is, each color band in the figure represents the degree to which child poverty would increase, in percentage points, if the program were removed. We complement this figure with Table 3.4, which shows percentage point reduction in poverty due to each program (parallel numbers to those presented in Figure 3.3), as well as the reduction in the number of children in poverty due to each program and the percent reduction. Below, we describe the changing role of each program in protecting children from poverty from 1993 to 2019, focusing our discussion on the relative percent reduction—a more comparable measure.
Figure 3.3. Child Poverty Rates Based on the Supplemental Poverty Measure (SPM), Calculated Without Individual Programs in the Social Safety Net, 1980-2019
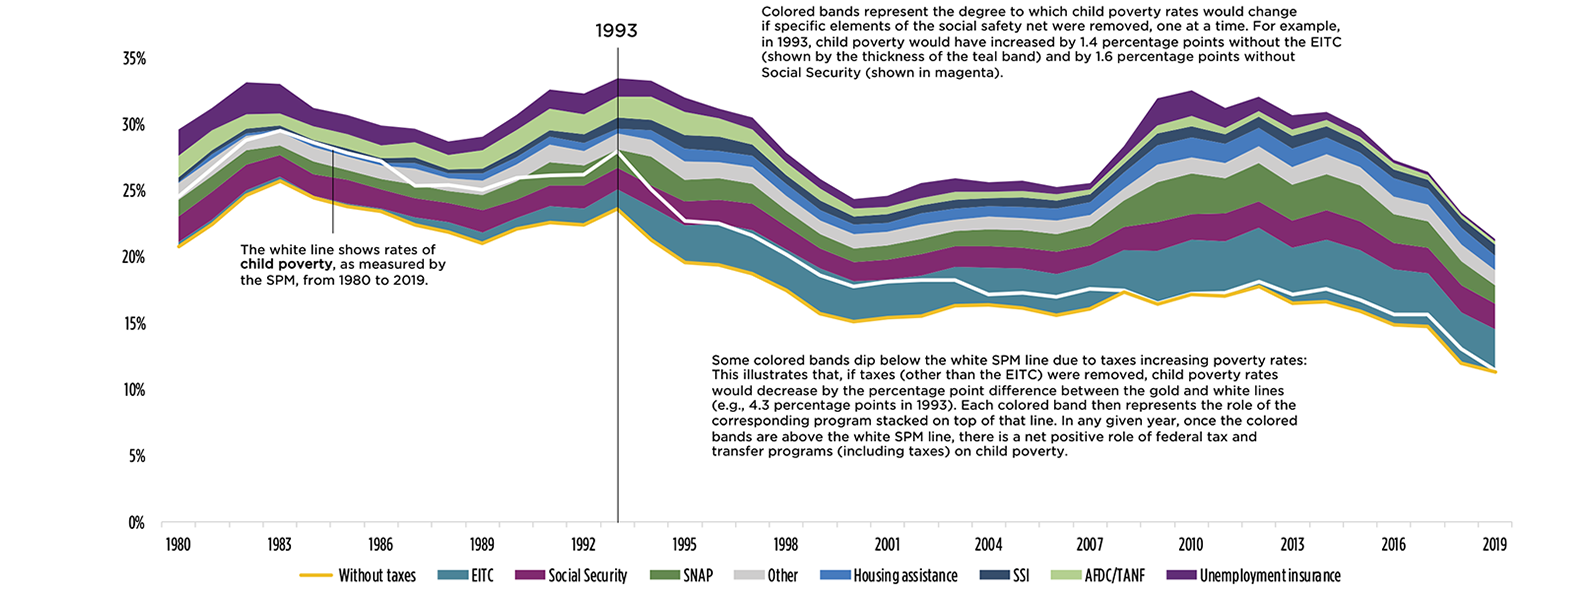
Notes: Taxes include federal taxes and refundable tax credits (including the Child Tax Credit), payroll taxes (FICA), state taxes, and stimulus payments (in 2008 and 2009). Other federal programs include the combined role of WIC, NSLP, and energy. The contribution of each program (or group of programs in the case of other federal programs) in protecting children from poverty is treated independently.
Source: Child Trends’ analysis of the historical Supplemental Poverty Measure data from the Columbia Center on Poverty and Social Policy, anchored to 2012 thresholds.
Table 3.4. Changes in Poverty Rates Associated With Programs in the Social Safety Net, 1993 & 2019
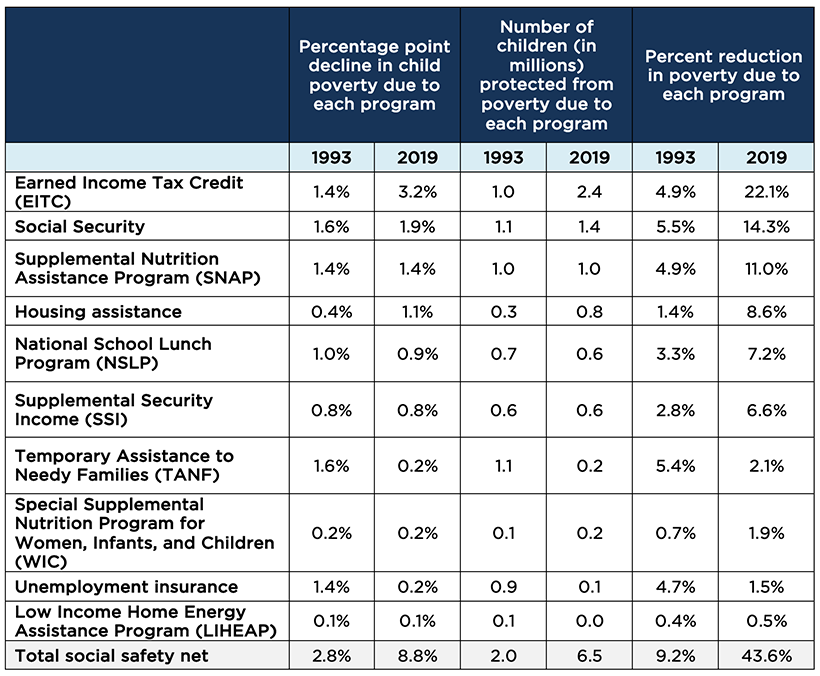
Notes: Percent decreases are in reference to what poverty rates would have been without the specific program in question. So, the denominator for each program-year is different. The contribution of each program in protecting children from poverty is treated independently.
Source: Child Trends’ analysis of the historical Supplemental Poverty Measure data from the Columbia Center on Poverty and Social Policy, anchored to 2012 thresholds.
The EITC became increasingly important in protecting children from poverty from 1993 to 2019.
-
- Since its creation in 1975, the EITC has grown to become the largest refundable tax credit and was the single program that protected the most children from poverty in 2019 (see Figure 3.4 and Table 3.4). As illustrated by the widening teal band in Figure 3.3, the EITC’s potential role in protecting children from poverty grew fairly consistently from 1980 to the present, with substantial expansions to eligibility and/or benefit levels in 1986, 1990, 1993, and 2001.
- The EITC’s role in protecting children from poverty naturally expanded during the Great Recession, likely because more children became eligible for the credit due to lower family incomes in the economic downturn. This may have been partially offset, however, by families with unemployed workers or lower earnings qualifying for smaller EITC benefits.
- In 1993, the EITC had the potential to reduce child poverty by 1.4 percentage points—a decrease of 5 percent compared to what the poverty rate would have been without the EITC. By 2019, the program had grown such that it had the potential to reduce child poverty by 3.2 percentage points, or 22 percent. The EITC protected 1.0 million children from poverty in 1993 and protected 2.4 million children from poverty in 2019.
While we highlight the role of the EITC here, our findings regarding the EITC’s role in lifting children out of poverty have important limitations, so we frame our findings as the potential role of the EITC. Our estimates of the role of the EITC are likely overstated, as the EITC values in the Historical SPM Dataset are simulated based on family income, and on family structure and composition. They do not account for whether family members have Social Security numbers, which have, since 1996, been required of all household members in order to receive the EITC—making 21 percent of children in poverty ineligible to receive EITC benefits. The simulated values also do not account for the approximately 20 percent of tax filers who are eligible for, but do not claim, the EITC. Nor does the simulation account for workers who do not routinely file taxes because they have no tax liability, but are nonetheless eligible for, and would receive, the EITC if they were to file taxes.[3]
Taxes and the EITC
The EITC is embedded in the federal tax system. Even though many families with incomes below the poverty line do not have federal tax obligations, they still pay payroll taxes and, sometimes, state taxes, which together likely reduce their incomes. Payroll taxes are taken directly out of paychecks through the Federal Insurance Contributions Act and go toward Medicaid and Social Security. Refundable tax credits have been more recent additions to our tax systems and, because of their refundability, have been highlighted as effective mechanisms for reducing poverty. While nonrefundable tax credits are less likely to benefit families in poverty who have no federal tax liability, families who are eligible for refundable tax credits receive cash back from the government for the amount of the credit minus any taxes. In this way, refundable tax credits operate a lot like cash transfers, which can both counteract any taxes paid into the system and/or be a net positive addition to a family’s income. The largest refundable tax credit is the EITC. Within the Historical SPM Data, other (at least partially) refundable tax credits—such as the CTC, Additional Child Tax Credit (ACTC), and Child and Dependent Care Tax Credit (CDCTC)—are included with other taxes and cannot be examined separately without additional simulations.
When examining the social safety net as a whole, we factor in the tax system at large. Figures 3.3 and 3.7 also present the role of the tax system at large—including federal and state income tax, Federal Insurance Contributions Act tax, refundable tax credits either than the EITC, and economic stimulus payments during the Great Recession. Consumption taxes are not captured in the data. The yellow band at the bottom of the figures shows that, in most years, without the EITC, the tax system would push children into poverty. When considering taxes together with all refundable tax credits—including the EITC—federal taxes began protecting children from poverty in 1996.
Housing assistance played a growing but modest role in protecting children from poverty.
-
- Housing assistance provides families with access to low-cost housing options and, as housing costs have grown over time, the cash value of housing assistance has increased, although its reach has slightly declined (see Table 3.2).
- During our study period, housing assistance played a growing but modest role in protecting children from poverty. That is, the percent of children protected from poverty by housing assistance grew steadily from 1980 to 2019 but remained modest.
- Housing assistance decreased child poverty rates by 0.4 percentage points in 1993—a decrease of 1 percent. By 2019, the role of housing assistance grew such that it decreased child poverty by 1.1 percentage points, or 9 percent. Housing assistance protected 290,000 children from poverty in 1993 compared with 790,000 children in 2019.
SNAP played a large role in protecting children from poverty from 1993 to 2019, although its role ebbed and flowed with economic cycles.
-
- SNAP’s role in protecting children from poverty grew from 1993 to 2019: SNAP reduced poverty by 5 percent in 1993 and 11 percent in 2019.
- SNAP was particularly important during the Great Recession as 1) more families became eligible because they had lower incomes and 2) it was temporarily expanded as part of the American Recovery and Reinvestment Act (ARRA). Following the Great Recession, the role of SNAP began to shrink again, particularly after the expiration of the temporary increase in benefits through ARRA.
- Without SNAP, approximately 1 million more children would have lived in poverty in both 1993 and 2019. While the number of children protected from poverty was similar in 1993 and 2019, the role of SNAP was greater in 2019 because child poverty rates were lower to begin with.
- The modeling of SNAP receipt may be particularly sensitive to underreporting of program participation in surveys used for this research, so these may be underestimates.
Social Security and unemployment insurance, programs that were not designed explicitly to protect children from poverty, nevertheless played an important role in reducing child poverty from 1993 to 2019.
-
- Social Security
- While not designed for children, a significant number of children benefit from Social Security when their household has experienced the loss of income due to a caregiver or other family member’s retirement, disability, or death. A growing share of children in the United States live with grandparents, for example, and Social Security benefits for a retired grandparent living with their grandchild contribute to the household’s economic resources.
- Social Security’s role in protecting children from poverty grew during this time. In 1993, Social Security reduced poverty by 6 percent (in absolute terms, 1.1 million fewer children were in poverty). By 2019, it reduced poverty by 14 percent (1.4 million fewer children).
- Social Security is not means-tested, meaning there are no income limits on who can receive benefits. Correspondingly, we do not see contractions and expansions with changing economic conditions.
- Unemployment insurance
- Unemployment insurance provides temporary, partial income replacement to workers who are involuntarily unemployed. Benefit amounts are based on prior employment status and earnings, and parents with lower previous earnings receive less in benefits.
- The role of unemployment insurance[4] in protecting children from poverty generally rose and fell in sync with economic cycles during our study period. Although unemployment insurance does not stand out as an anti-poverty program during economic booms, during economic downturns it plays a critical role in buffering the economy’s impact on child poverty. In 2000, during a time of economic boom, unemployment insurance reduced child poverty by 4 percent. In 2009, during a time of economic recession, unemployment insurance decreased child poverty by 11 percent.
- Social Security
The role of additional social safety net programs in protecting children from poverty also increased modestly from 1993 to 2019.
-
- Supplemental Security Income (SSI) provides monthly income to families with limited income who have a disabled family member, including a child with a disability. Its relative role grew modestly from 1993 to 2019. In 1993, SSI reduced poverty by 3 percent, and by 7 percent in 2019. In both 1993 and 2019, SSI protected about 570,000 children from poverty.
- The role of other federal programs—including the Special Supplemental Nutrition Program for Women, Infants, and Children (WIC); the National School Lunch Program (NSLP); and Low-income Home Energy Assistance Program (LIHEAP) subsidies—in protecting children from living in poverty also grew from 1993 to 2019. We group these three programs together because previous research shows that, on their own, they each play fairly minor roles in protecting children against poverty. Of the three programs, the NSLP lowers child poverty rates by the largest amount: NSLP lowered child poverty rates by about 7 percent in 2019, compared to 3 percent in 1993. WIC is the second-largest program, even though it is targeted at young children, and lowered child poverty rates by 1.9 percent in 2019, compared to 0.7 percent in 1993. LIHEAP is the smallest of these other federal programs: Its role grew very slightly, from 0.4 percent in 1993 to 0.5 percent in 2019. Taken together, these three programs protected about 860,000 children from living in poverty in 2019.
- While the number of children protected from poverty by these programs was similar in 1993 and 2019, their roles grew because child poverty rates were lower in 2019 to begin with.
While AFDC, now TANF, was once a major player in protecting children from poverty, TANF now plays a minimal role.
-
- The role of AFDC/TANF in protecting children from poverty declined dramatically from 1980 to 2019, as illustrated by the shrinking light green–colored band in Figure 3.3.
- In the 1980s and early 1990s, AFDC/TANF was one of the most influential programs in the social safety net protecting children from poverty (along with unemployment Insurance, Social Security, and SNAP). AFDC’s role had already diminished by 1993, when it lowered child poverty rates by 5 percent. By 2019, TANF’s role was minimal in protecting children from poverty: It decreased poverty by 2 percent and protected 180,000 children from poverty—just a fraction of the 1.1 million children protected from poverty by AFDC in 1993.
In 2019, the programs that reduced child poverty the most were the EITC, Social Security, and SNAP (see Figure 3.4).
-
- In 2019, the EITC had the potential to reduce child poverty by 3.2 percentage points, or 22 percent, and to protect 2.4 million children from poverty.
- In 2019, Social Security was the second-most influential program protecting children from poverty, according to our analyses. Social Security reduced child poverty by 1.9 percentage points in 2019, or 14 percent, and protected 1.4 million children from poverty.
- In 2019, SNAP reduced poverty by 1.4 percentage points, or 11 percent. Without SNAP, approximately 1.0 million more children would have lived in poverty in 2019. We have classified SNAP as the social safety net anti-poverty program with the third-largest role in protecting children from poverty. This finding should be interpreted with caution, however. The modeling of SNAP receipt is sensitive to underreporting of program participation in surveys used for this research. Previous research has been able to adjust for this underreporting, finding that, in 2015, SNAP was the second-largest anti-poverty program in the social safety net, protecting more than twice as many children from poverty as Social Security.
Figure 3.4. Percent Decreases in Child Poverty Rates, Based on the Supplemental Poverty Measure (SPM), Attributable to Programs That Make Up the Social Safety Net, 1993 & 2019
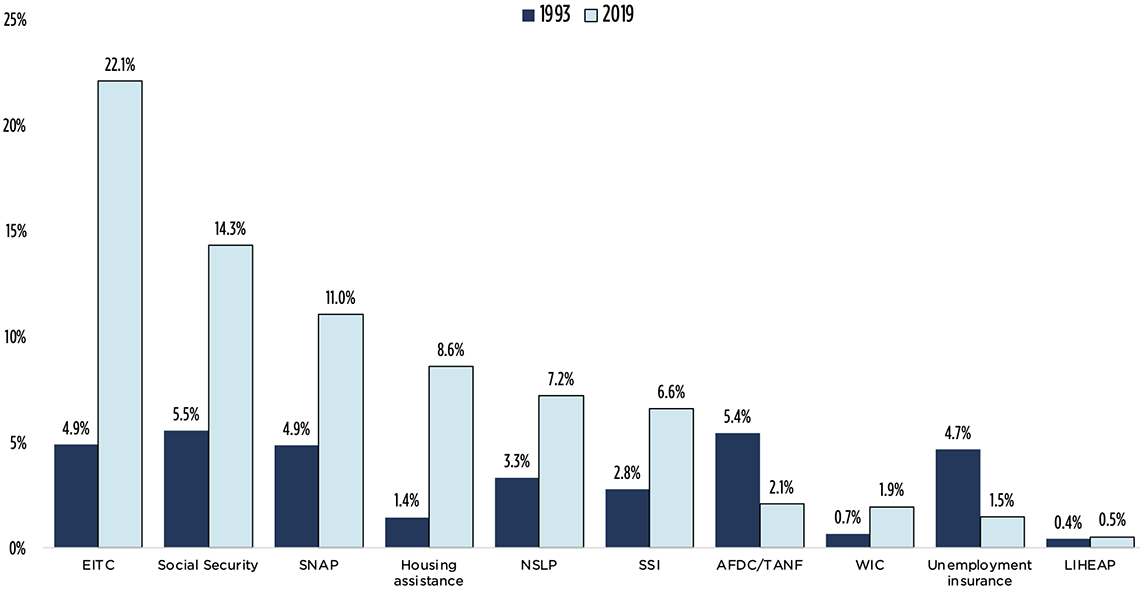
Notes: Percent decreases are in reference to what poverty rates would have been without the specific program in question. So, the denominator for each program-year is different. The contribution of each program in protecting children from poverty is treated independently.
Source: Child Trends’ analysis of the historical Supplemental Poverty Measure data from the Columbia Center on Poverty and Social Policy, anchored to 2012 thresholds.
Interplay between anti-poverty programs in reducing poverty
Now that we’ve examined the overall role of the social safety net in protecting children from poverty, as well as the role of individual programs, we briefly examine the interplay between programs to better understand how programs work in tandem with one another to protect children from poverty. It is possible that a child could be lifted across the poverty line by participating in a single program. However, a child’s family may need to participate in multiple programs to cross the poverty line.
To examine the interplay between programs, we compare the total role of the social safety net calculated in two ways: 1) We look at the additive role of each program treated independently; and 2) we look at the role of the social safety net as a single whole. Starting with the first approach, if we were to add the number of children protected from poverty by each individual program in Table 3.4, we would get 6.9 million children protected from poverty in 1993 and 7.3 million children in 2019. There is overlap in the children served by each program, however (e.g., a child receives both SNAP and the EITC), so we also look at the total number of children lifted out of poverty by the entire safety net; thus, we see that, in total, 2.0 million children were lifted out of poverty in 1993 and 6.5 million were lifted out of poverty in 2019. This tells us that the social safety net lifted fewer children out of poverty than the sum of each individual program in both 1993 and 2019. In other words, there was overlap in the population of children lifted out of poverty by each program. Some children were pushed over the poverty line by a single program but participated in multiple. There was more overlap in 1993 than in 2019.
Next, we examine how the social safety net protected children from a more severe level of economic deprivation—deep poverty, which is an experience with well-documented negative developmental consequences.
Section 3: The role of the social safety net in reducing deep poverty among children
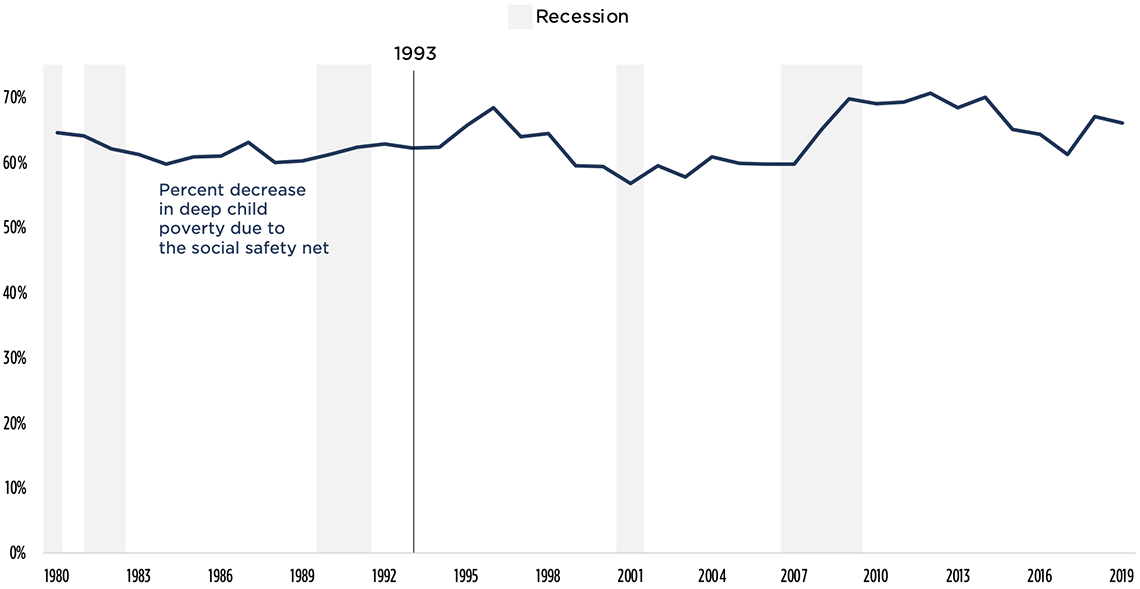
As with overall child poverty, deep poverty also declined dramatically from 1993 to 2019—by 56 percent (see dark blue line in Figure 3.5), and the social safety net has consistently protected a large share of children against deep poverty. But the safety net played less of a role in this decline than it did for the decline in child poverty as a whole.
The social safety net has consistently been a hugely important protector of children against deep poverty. In both 1993 and 2019, the social safety net reduced the rate of child deep poverty by about two-thirds. In 1993, the safety net reduced child deep poverty by 62 percent and, in 2019, by 66 percent (see Figure 3.6).
In absolute numbers, though, the social safety net protected fewer children from deep poverty in 2019 than in 1993: In 1993, the safety net reduced deep poverty by 12 percentage points and protected 8.4 million children from deep poverty. In 2019, the safety net reduced deep poverty by 6.3 percentage points and protected 4.6 million children from deep poverty.
How could the social safety net’s relative role in protecting children from deep poverty stay steady while its absolute role shrank? There were fewer children in deep poverty without the safety net in 1993 than there were in 2019, largely due to changing economic and demographic conditions in the United States (see discussion in Chapter 2).
Because the relative role of the social safety net has remained relatively stable over time, it was not a large contributor to the decline in child deep poverty from 1993 to 2019. This story is very different from what we saw with child poverty overall. While the role of the social safety net increased dramatically in protecting children from poverty from 1993 to 2019, its role did not grow in the same way to protect children from deep poverty.
Figure 3.5. Child Deep Poverty Rates, Based on the Supplemental Poverty Measure (SPM), Calculated With and Without the Social Safety Net, 1980-2019
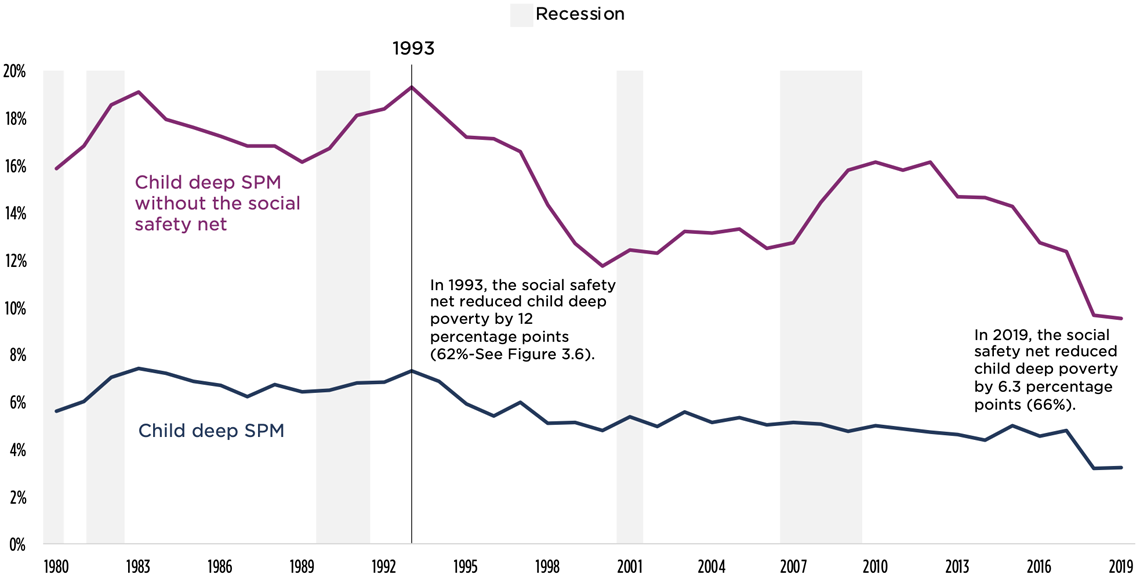
While the role of the social safety net in protecting children from deep poverty was similar in 1993 and 2019, there were fluctuations over this time. From 1996—when PRWORA was enacted—to 2007, the role of the social safety net in protecting children from deep poverty shrank, as illustrated by Figure 3.5 and the decline in its deep poverty reduction role shown in Figure 3.6. The role of the social safety net increased again in 2008, corresponding to the Great Recession. However, after the Great Recession, the social safety net’s role in protecting children from deep poverty shrank again before increasing in the late 2010s.
Figure 3.6. Percent Decrease in Child Deep Poverty Due to the Social Safety Net, 1980-2019
We also examine how far out of deep poverty children are lifted by the social safety net. The average child who was lifted out of deep poverty by the social safety net remained below the poverty threshold (see Table 3.5) in both 1993 and 2019. On average, children who were lifted out of deep poverty by the social safety net were not lifted out of poverty completely, but had family resources just below the poverty threshold. In 1993, about one in 10 children lifted out of deep poverty by the safety net were lifted across the poverty threshold. This grew to almost one in four children in 2019.
Similarly, the social safety net may have been able to lift children higher out of deep poverty in 2019 than in 1993, as the average income-to-needs ratios after the social safety net was higher in 2019 than in 1993. However, children who were lifted out of deep poverty by the social safety net in 2019 were slightly better off to begin with (as seen by the higher average income-to-needs ratio before the social safety net), relative to children who were lifted out of deep poverty by the social safety net in 1993.
Table 3.5. Mean Income-to-Needs Ratios Without and With the Social Safety Net, Among Children Lifted Out of Deep Poverty by the Social Safety Net, 1993 & 2019

Roles of individual programs in the social safety net in protecting children from deep poverty
In the 1980s and early 1990s, the social safety net’s protection against child deep poverty was concentrated in two programs: AFDC (now TANF) and Food Stamps (now SNAP). The role of both programs diminished over the past 25 years, albeit to varying degrees. The roles of other programs, though—notably Social Security and the EITC—increased from 1993 and 2019, partially filling the gap left by TANF.
-
- While AFDC was the most influential program protecting children from deep poverty in the 1980s and early 1990s, AFDC/TANF’s role in protecting children against deep poverty greatly diminished during the mid- to late-1990s, following the passage of PRWORA, which instated work requirements and time limits, eliminated eligibility for many immigrants, and allowed states to use block grant funds for non-direct cash transfers (see Figure 3.7). In 1993, TANF lowered child deep poverty rates by a notable 38 percent, corresponding to 3.1 million children protected from deep poverty (see Table 3.6 and Figure 3.8). By 2019, TANF lowered child deep poverty rates by just 4 percent, protecting about 100,000 children from deep poverty.
- In 1993, Food Stamps, as SNAP was then known, decreased child deep poverty rates by 29 percent and protected more than 2 million children from living in deep poverty. By 2019, SNAP decreased deep poverty rates by 21 percent and protected 620,000 children from deep poverty.
- The role of Social Security increased from 1993 to 2019: In 2019, it reduced deep poverty by more than a quarter (29%), while in 1993, it reduced deep poverty by 18 percent. Its increased role may be due, in part, because the number of children lifted out of deep poverty by Social Security remained about the same (decreasing only slightly) while deep poverty rates overall declined across this period.
- The role of the EITC also increased from 1993 to 2019. In 2019, the EITC reduced deep poverty by 18 percent; by comparison, it reduced deep poverty by 12 percent in 1993.
Figure 3.7. Child Deep Poverty Rates, Based on the Supplemental Poverty Measure (SPM), Calculated Without Individual Programs in the Social Safety Net, 1980-2019
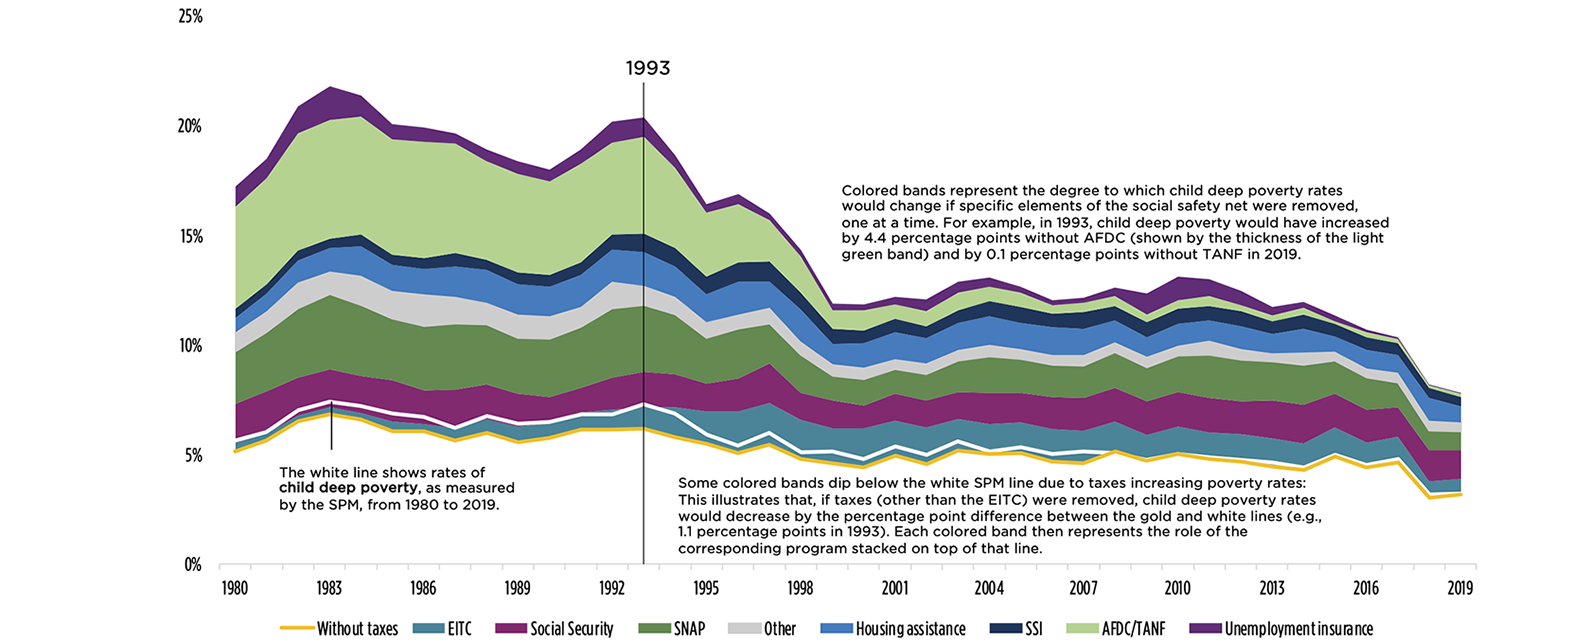
Notes: Taxes include federal taxes and refundable tax credits (including the Child Tax Credit), payroll taxes (FICA), state taxes, and stimulus payments (in 2008 and 2009). Other federal programs include the combined role of WIC, NSLP, and energy. The contribution of each program (or group of programs in the case of other federal programs) in protecting children from poverty is treated independently.
Source: Child Trends’ analysis of the historical Supplemental Poverty Measure data from the Columbia Center on Poverty and Social Policy, anchored to 2012 thresholds.
Table 3.6. Changes in Child Deep Poverty Rates Associated With Programs in the Social Safety Net, 1993 & 2019
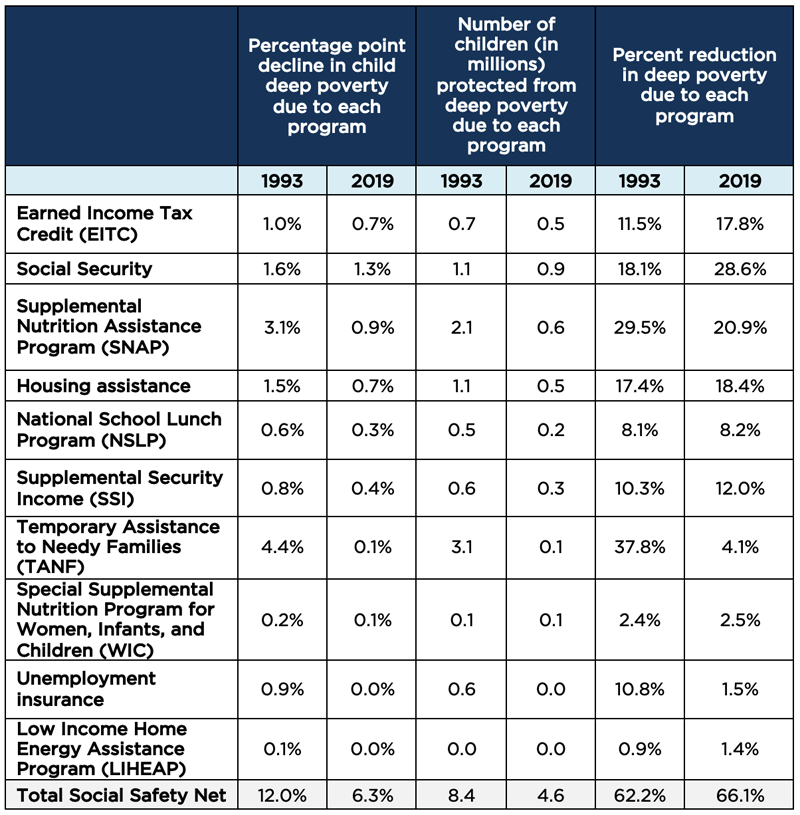
Notes: Percent decreases are in reference to what poverty rates would have been without the specific program in question. So, the denominator for each program-year is different. The contribution of each program in protecting children from poverty is treated independently.
Source: Child Trends’ analysis of the historical Supplemental Poverty Measure data from the Columbia Center on Poverty and Social Policy, anchored to 2012 thresholds.
Among the programs examined, the most important programs protecting children from deep poverty in 2019 were Social Security, SNAP, housing assistance, and the EITC (see Figure 3.8). Each of these programs independently reduced child deep poverty rates by at least 17 percent, and each protected approximately half a million children or more from living in deep poverty in 2019. While Social Security plays the largest role in protecting children from living in deep poverty in our analyses, previous research that adjusted for underreporting of household incomes found that SNAP was the largest anti-poverty program in the social safety net protecting kids from deep poverty. For children in deep poverty, housing assistance plays about an equally large role in reducing deep poverty as the EITC.
Figure 3.8. Percent Decrease in Child Deep Poverty Rates, Based on the Supplemental Poverty Measure (SPM), Attributable to Programs That Make Up the Social Safety Net, 1993 & 2019
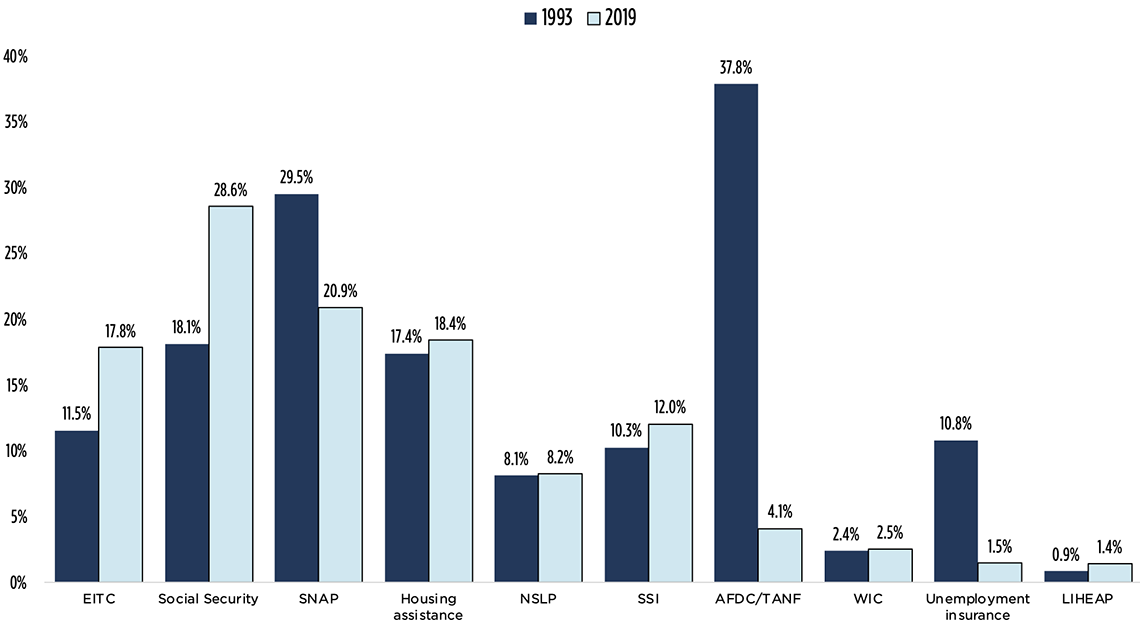
Notes: Percent decreases are in reference to what poverty rates would have been without the specific program in question. So, the denominator for each program-year is different. The contribution of each program in protecting children from poverty is treated independently.
Source: Child Trends’ analysis of the historical Supplemental Poverty Measure data from the Columbia Center on Poverty and Social Policy, anchored to 2012 thresholds.
Compared to their role in protecting children against poverty generally, many anti-poverty programs were particularly important protectors against deep poverty. The following programs reduced deep poverty by approximately double the percent at which they reduced poverty: LIHEAP, housing assistance, Social Security, TANF, SNAP, and SSI. Conversely, while the EITC plays a moderate role in protecting children from deep poverty, it is more important for protecting children from poverty than from deep poverty. This finding is consistent with previous research finding that tax-based programs are more influential for families just below the poverty threshold, while means-tested programs are more influential for families in deep poverty.
Interplay between anti-poverty programs in reducing deep poverty
Finally, we examine the interplay between programs to better understand how programs work in tandem to protect children from deep poverty. As we saw with poverty, it is possible for a child to be lifted across the deep poverty line by participating in a single program or by participating in multiple programs. To examine the interplay between programs, we again compare the total role of the social safety net calculated in two ways: 1) We look at the additive role of each program treated independently; and 2) we look at the role of the social safety net as a single whole.
In 1993, totaling the number of children protected from deep poverty by each individual program in Table 3.6 independently shows us that 9.9 million children would have been lifted out of deep poverty, compared with the 8.4 million children actually lifted out of deep poverty by the entire social safety net. This is similar to the pattern we see for poverty and indicates that some children were lifted out of poverty by a single program but were served by multiple programs. Nonetheless, as shown above, the vast majority of children lifted out of deep poverty by the social safety net still have resources below the poverty line.
The story is different in 2019, however. In 2019, more children were lifted out of deep poverty by the entire social safety net (4.6 million) than the sum of its individual parts (3.4 million). How is this possible? This suggests that, in 2019, more children likely needed benefits from multiple social safety net programs to escape deep poverty. In other words, in 2019, it was less likely that a single program was sufficient to lift a child out of deep poverty; rather, a combination of benefits across multiple programs was often needed to pull a child out of deep poverty.
Section 4: Summary and discussion
In this chapter, we set out to examine the role of the social safety net in reducing child poverty during its historic decline over the past quarter century. We found different answers for poverty and deep poverty: While the social safety net played a major role in the reduction of child poverty, it contributed little to the decline in child deep poverty.
Role of the social safety net in reducing child poverty
The social safety net’s role in protecting children from poverty grew, alongside increases in federal spending, from 1993 to 2019, corresponding to the overall decline in child poverty. As child poverty rates fell from 28 percent in 1993 to 11 percent in 2019, the social safety net played an increasingly important role in protecting children from poverty. At the start of the decline, in 1993, the entire social safety net reduced child poverty by 9 percent. In 2019, the social safety net reduced child poverty by 44 percent.
The greatest growth in the percent of children protected from poverty was seen for the EITC and housing subsidies, but housing subsidies still made only a modest contribution to the reduction in child poverty. In 2019, the three programs that played the largest role in reducing poverty were the EITC, Social Security, and SNAP. Each program alone protected approximately 1 million children or more from poverty in 2019.
Programs that were not designed explicitly to protect children from poverty are nevertheless important. While not frequently thought of as an anti-poverty program for children, we found that Social Security played a fairly large and consistent anti-poverty role for children. Unemployment insurance also played an important role in protecting children from poverty during economic downturns.
Whereas AFDC (the predecessor to TANF) was once a major player in protecting children from poverty—surpassing the role of EITC and SNAP in 1993 and on par with that of Social Security—it now plays a minimal role. The decreasing role of cash welfare (i.e., AFDC/TANF) and the increasing role of the EITC, which is conditional on earnings, is reflective of the transition away from out-of-work support to an emphasis on work-based programs. While the expansion of the EITC, in particular, contributed substantially to the increased role of the social safety net in protecting children from poverty, this shift is not without consequences. Children whose parents are not stably employed may not fully benefit from the EITC, and children living in immigrant families—who are more likely to live with family members who do not have a Social Security number—may be excluded entirely. In Chapter 4, we focus our attention on who the social safety net works for, and who it leaves behind.
Role of the social safety net in reducing deep poverty among children
The social safety net consistently plays a hugely important role in protecting children from deep poverty. In both 1993 and 2019, the social safety net reduced deep poverty among children by about two thirds.
That said, while we saw a marked increase in the social safety net’s role in protecting children from poverty from 1993 to 2019, we saw only minimal growth in its role in reducing deep poverty. The social safety net reduced child deep poverty by 62 percent in 1993 and by 66 percent in 2019.
In the intervening years, however, there were notable changes in the social safety net’s role in reducing deep poverty. Following the passage of PRWORA in 1996 and continuing until 2006, the role of the social safety net in reducing deep poverty declined, and deep poverty rates among children increased. The role of the social safety net in protecting children from deep poverty increased again, however, with the introduction of temporary measures during the Great Recession, and much of the decline in deep poverty rates among children occurred after the economy strengthened again in the 2010s.
From 1993 to 2019, the role of TANF, the most historically important program for protecting children from deep poverty, greatly diminished. Much of this decline occurred during the mid- to late-1990s following the passage of PRWORA, which instated work requirements and time limits, eliminated eligibility for many immigrants, and allowed states to use block grant funds for non-direct cash transfers. The role of SNAP also declined slightly during this same time. However, the role of other programs—notably Social Security and EITC—increased moderately from 1993 to 2019, partially filling the gap left by TANF in particular.
Click to continue to Chapter 4: A Subgroup Analysis of Child Poverty Shifts
View Chapter 4Chapter 3 Endnotes
[1] Note that we are not able to separately examine the role of each of these programs in our analyses due to data limitations. We cannot separate out the unique roles of the CTC, Medicaid, or child care subsidies. However, they are accounted for either directly or indirectly when we estimate poverty rates with the SPM.
[2] Data on the percent of child recipients above the poverty line were aggregated from annual USDA reports on Food Stamp/SNAP recipients entitled “Characteristics of Food Stamp Households” and “Characteristics of SNAP Households” from FY 1995 to 2019. Reports from 2017–2019 are available on the SNAP website; all preceding years are available on the USDA National Agricultural Library Digital Collections site.
[3] The overestimation of the EITC’s anti-poverty role using simulation methods has also been noted in recent work by Maggie Jones and James Ziliak. Previous research that corrects for the overestimation of the EITC, however, has also found it to be among the most important anti-poverty programs for children.
[4] In our data, this category includes unemployment insurance, workman’s comp, veterans’ payments, and government pensions.
© Copyright 2025 ChildTrendsPrivacy Statement
Newsletter SignupLinkedInYouTubeBlueskyInstagram