While the use of out-of-school suspension has decreased since school year 2011-12, schools continue to suspend their Black students and students with disabilities at disproportionate rates. Additionally, the use of suspension for Black students and students with disabilities decreased more slowly than among Hispanic students and students without disabilities, respectively. These findings update our 2019 analysis using new data from the Civil Rights Data Collection.
Students subjected to exclusionary discipline tactics such as out-of-school suspension lose instructional time from being out of school and are at greater risk for a cascade of negative outcomes, including poor academic achievement, school dropout, and contact with the criminal justice system. Accordingly, federal and state officials have advanced policies that discourage the use of out-of-school suspensions and expulsions as disciplinary practices when alternatives to exclusionary discipline are possible.
This brief updates Child Trends’ 2019 analysis of out-of-school suspension data with the most recent version of the Civil Rights Data Collection (CRDC), for school year (SY) 2017-18. Our findings remain unchanged from our original analysis of the SY 2015-16 CRDC, which suggested that overall rates of out-of-school suspension decreased from SY 2011-12 to SY 2015-16. At the national level, this held true for White students, Black students, Hispanic students, and students with and without disabilities. Despite the overall decreasing trend, Black students and student with disabilities continued to be suspended at higher rates than, respectively, White students and Hispanic students, and students without disabilities.
Now is a crucial time to understand how schools use out-of-school suspension to deal with student behavior. Not only will students return to school in-person in Fall 2021 after a traumatic pandemic year, but the Biden administration is considering new federal guidance on the use of exclusionary discipline.
Key Findings
Nationally, schools continued to slowly reduce their reliance on out-of-school suspension in SY 2017-18.
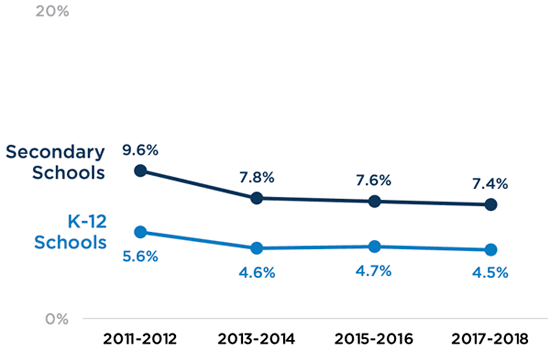
In SY 2017-18, K-12 schools suspended an average of 4.5 percent of their students, down from 5.6 percent in SY 2011-12. Secondary schools (generally considered middle and high schools; see the methodology appendix for full definition) suspended an average of 7.4 percent of their students, compared with 9.6 percent in 2011-12. Note: Our analysis calculates the percentage of students suspended in the average school. This differs from other analyses that focus on the overall risk of a student experiencing a suspension.
Figure 1. Suspension Rates in the Average K-12 and Secondary School, National, SYs 2011-12 to 2017-18
Source: U.S. Department of Education, Office for Civil Rights, Civil Rights Data Collection (CRDC; Restricted Use), 2011-12 – 2017-18
In our analysis, schools’ reliance on out-of-school suspension varied by state. While the average school in most states decreased its use of out-of-school suspensions since SY 2011-12, the use of exclusionary discipline in a few states has remained consistently high. Notably, K-12 schools in Mississippi and South Carolina reported suspending more than 10 percent of their students, on average, in SY 2017-18; these rates have increased since SY 2011-12. At the secondary level, schools suspended more than 15 percent of their students, on average, in Washington, DC, Mississippi, and South Carolina. Notably, though, DC’s reliance on out-of-school suspension has decreased over time: In SY 2011-12, the average school suspended 28 percent of its students, but this number dropped to 16 percent in SY 2017-18.
Schools’ reliance on out-of-school suspension decreased from SY 2011-12 to SY 2017-18 for Black, White, and Hispanic students, and for students with and without disabilities; however, this decrease occurred at uneven rates.
To understand whether these reductions were experienced equitably by students of different races and for students with and without disabilities, we analyzed data separately for each of five subgroups: White students, Black students, Hispanic students, students with disabilities, and students without disabilities.
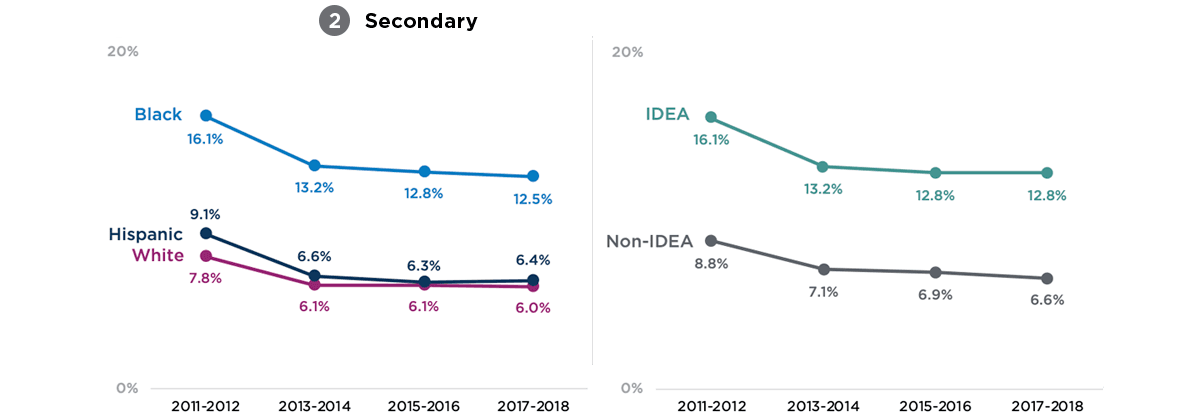
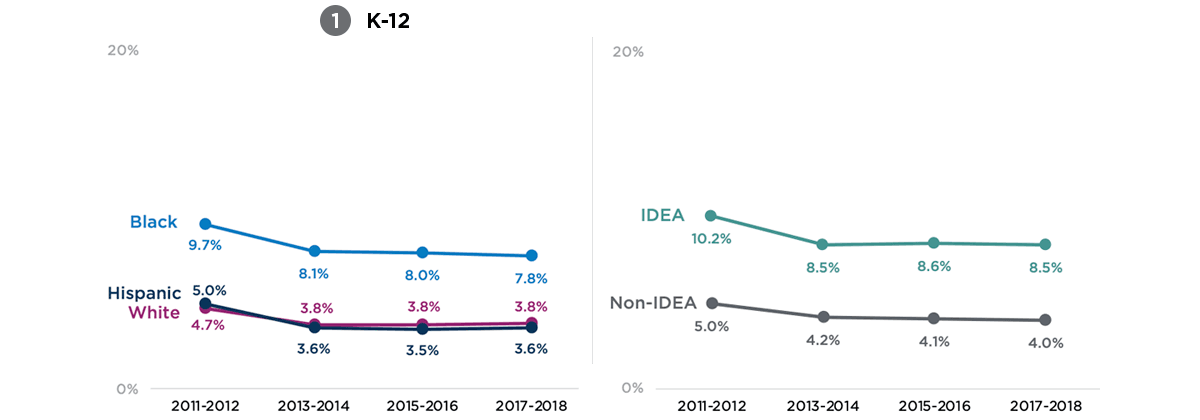
Figure 2. Suspension Rates in the Average K-12 and Secondary School by Student Race/Ethnicity and IDEA Status, National, SYs 2011-12 to 2017-18
Click the arrows on either side of the figure to view the trend lines for (1) K-12 schools or (2) secondary schools.
Source: U.S. Department of Education, Office for Civil Rights, Civil Rights Data Collection (CRDC; Restricted Use), 2011-12 – 2017-18
School-level out-of-school suspension rates for Hispanic students decreased more quickly than for Black and White students, both in K-12 schools and secondary schools. The average K-12 school-level prevalence of out-of-school suspensions decreased for Hispanic students from 5.0 percent in SY 2011-12 to 3.6 percent in SY 2017-18—a reduction of roughly 30 percent. In the average K-12 school, Hispanic students were suspended at lower rates than White students, starting in SY 2013-14. Reliance on suspension similarly decreased in secondary schools, but Hispanic students are still suspended at higher rates than White students at this level (6.4% vs 6.0%, respectively, in SY 2017-18).
School-level suspension rates for Black students remain substantially higher than rates for Hispanic and White students, and schools’ reliance on suspension for Black students has decreased at a slower rate than for Hispanic students, albeit at a similar rate to White students. The average school-level prevalence of suspensions for Black students decreased by 19.5 percent, from 9.7 percent in SY 2011-12 to 7.8 percent in SY 2017-18.
K-12 schools’ usage of out-of-school suspension has also fallen for students with disabilities, from 10.2 percent in SY 2011-12 to 8.5 percent in SY 2017-18—a reduction of 17 percent. This reduction is smaller than seen among students without disabilities.
Despite reduced reliance on out-of-school suspension, in SY 2017-18, schools still suspended their Black students and students with disabilities at rates more than twice as high as, respectively, White and Hispanic students and students without disabilities.
On average, public K-12 and secondary schools suspended all five subgroups at lower rates in SY 2017-18 than in SY 2011-12. However, both K-12 and secondary schools have consistently suspended their Black students at rates twice as high as their White and Hispanic students, and have suspended their students with disabilities at rates more than twice as high as their students without disabilities. This remained true in SY 2017-18.
The number of schools reporting disproportionate use of suspensions against Black and Hispanic students—compared to White students—decreased over time, albeit slowly for Black students.
Despite the decreased use of suspensions in all subgroups, the proportion of Black students suspended remain high, relative to their peers at the same schools from other racial or ethnic groups.
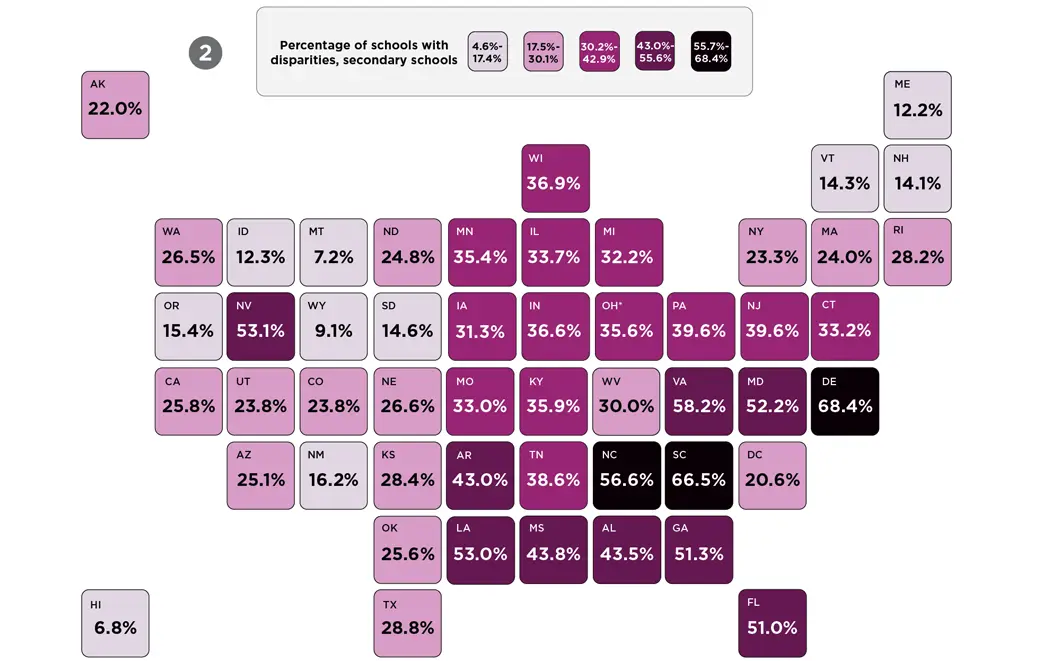
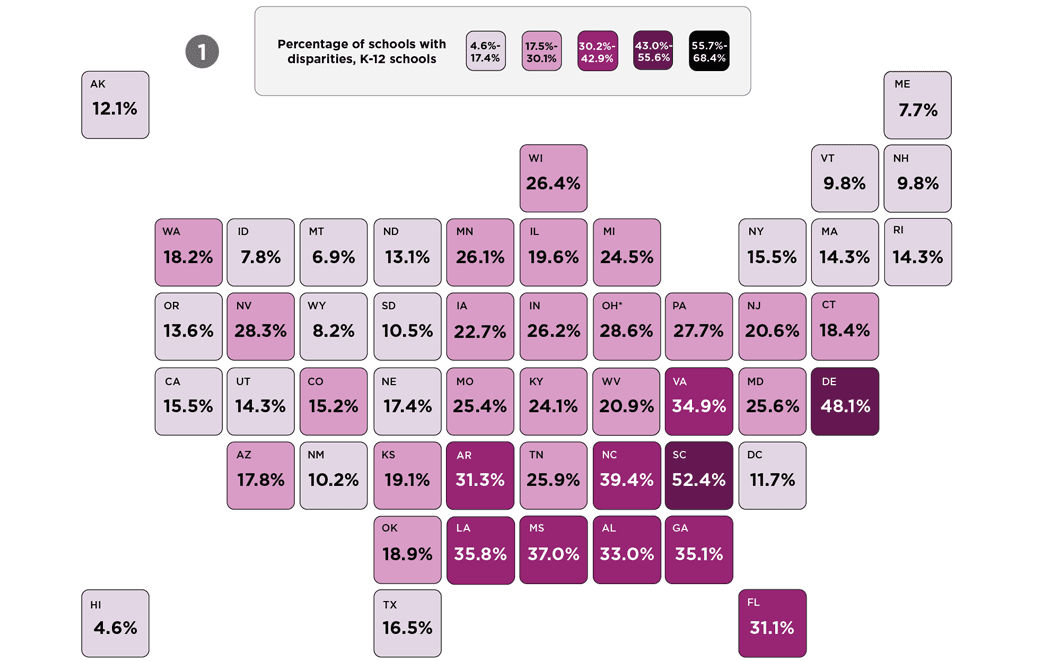
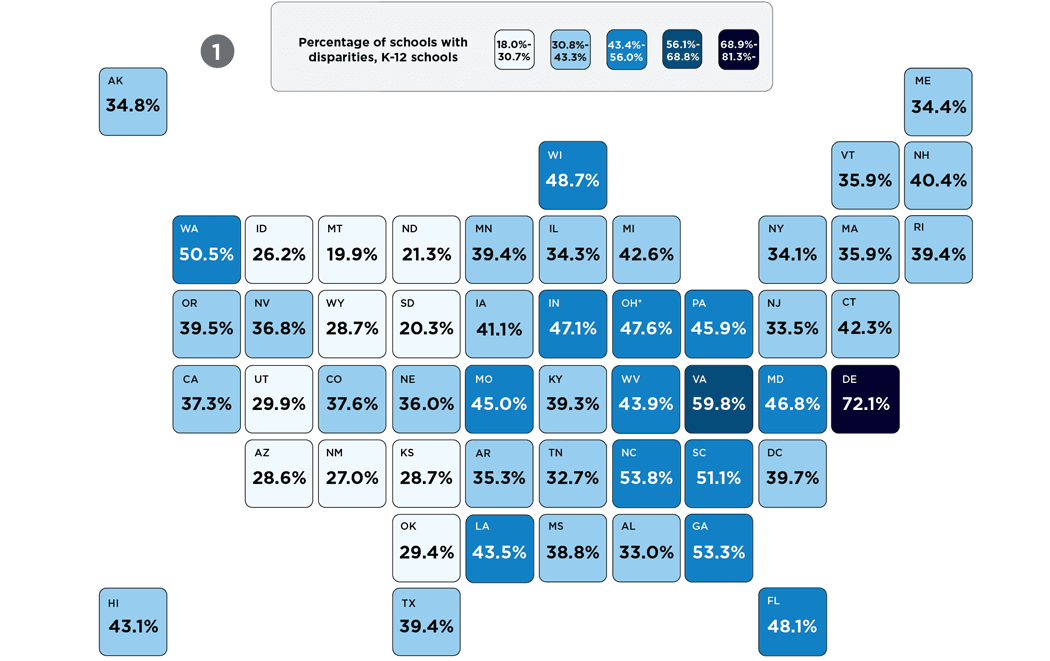
We compared rates of suspension across race/ethnicity within the same school serving at least one Black and one White student, which revealed that one in five K-12 public schools (22.5%) and one in three public secondary schools (34.3%) disproportionately suspended their Black students at higher rates than their White students. The proportion of K-12 schools with such disparities has decreased since SY 2011-12, from 25.3 percent to 22.5 percent—a reduction of 11.1 percent.
The proportion of schools that disproportionately suspend their Hispanic students (relative to their White students) has also declined over time. From SY 2011-12 to SY 2017-18, there was an approximately 30 percent reduction in the percentage of public schools (both K-12 and secondary) suspending Hispanic students at disproportionately higher rates than White students. In SY 2017-18, 6.3 percent of K-12 schools and 11.5 percent of secondary schools disproportionately suspended their Hispanic students compared to their White students.
Note: These maps show the percentage of schools with at least one Black and one White student in which Black students were disciplined using out-of-school suspension at a higher rate than their White peers, in SY 2017-18.
Figure 3. Within-School Disparities in Suspension by Race (Black-White), in K-12 Schools and Secondary Schools, SY 2017-18
Click the arrows on either side of the map to view data for Black and White students in (1) K-12 schools or (2) secondary schools.
* OH’s estimates were not included in national totals
Source: U.S. Department of Education, Office for Civil Rights, Civil Rights Data Collection (CRDC; Restricted Use), 2017-18.
Two in five schools disproportionately suspend their students with disabilities, relative to students without disabilities, a trend that held steady from 2011-2018.
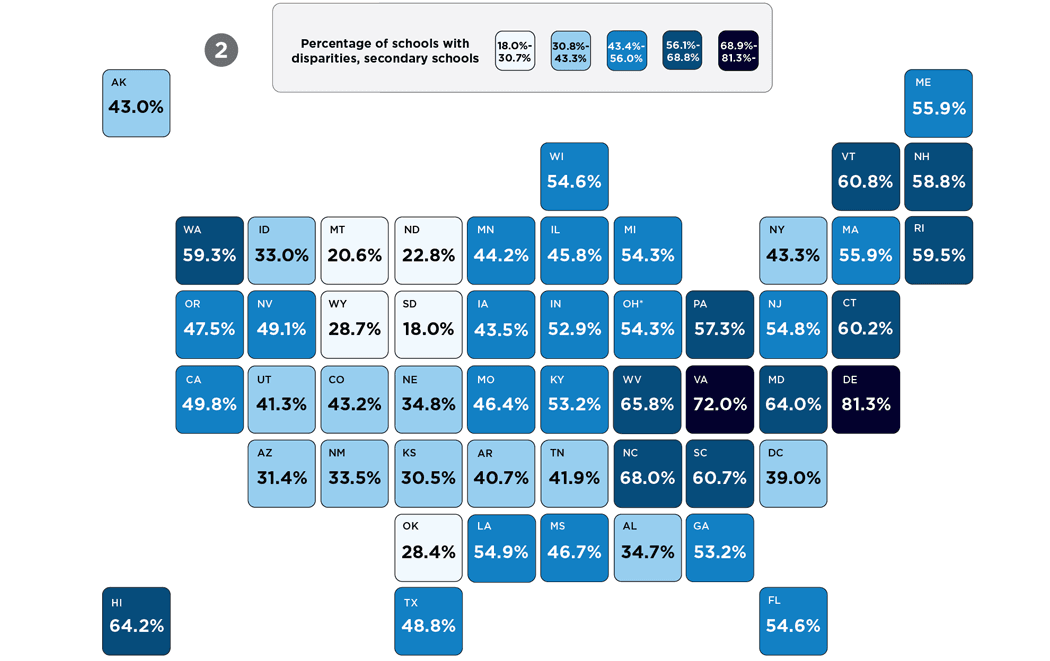
Since SY 2011-12, approximately 40 percent of K-12 schools and half of secondary schools have disproportionately suspended students with disabilities; the proportion of schools with disparities in suspension by student disability remained stagnant in SY 2017-18. In SY 2017-18, two in five (39.9%) public K-12 schools and half (48.8%) of secondary schools suspended students with disabilities at disproportionately higher rates than their peers without disabilities. This represents a 5.2 percent increase in rates of suspensions for students with disabilities in K-12 schools and a 1.1 percent increase in secondary schools, relative to SY 2011-12.
Note: These maps show the percentage of schools with at least one IDEA and one non-IDEA student in which IDEA students were disciplined using out-of-school suspension at a higher rate than their non-IDEA peers, in SY 2017-18.
Figure 4. Within-School Disparities in Suspension by IDEA Status, in K-12 Schools and Secondary Schools, SY 2017-18
Click the arrows on either side of the map to view data for IDEA and non-IDEA students in (1) K-12 schools or (2) secondary schools.
* OH’s estimates were not included in national totals
Source: U.S. Department of Education, Office for Civil Rights, Civil Rights Data Collection (CRDC; Restricted Use), 2017-18
Conclusion
Overall, schools’ reliance on out-of-school suspension continues to decrease. On average, schools are suspending fewer students across racial and ethnic groups and by disability status. However, out-of-school suspension remains a widespread practice: 2.5 million students were suspended in SY 2017-18, a year in which students lost more than 11 million days of instruction due to out-of-school suspensions. Furthermore, progress to reduce schools’ reliance on out-of-school suspension is slow and uneven.
While schools’ use of out-of-school suspension is declining, schools are still more than twice as likely to suspend their Black students as their Hispanic or White students, and more than twice as likely to suspend students with disabilities than their peers without disabilities. The slow pace of reductions in the use of suspensions for Black students, compared to Hispanic students, also points to a need for more equitable school discipline practices. Previous research has found that nearly half of Black-White disparities in exclusionary discipline can be explained by the differential treatment of Black and White students within the same schools, pointing to the power that schools have to affect meaningful change by implementing equitable practices within their walls.
As schools return to in-person instruction after the COVID-19 pandemic, they will likely face additional behavioral challenges as students adjust to a new normal. As schools work to move away from exclusionary discipline to more supportive approaches, they should plan for these anticipated challenges by pursuing policies that focus on the whole child, including additional supports for students’ mental health and training for teachers. Without intentionality, the return to in-person schooling is likely to lead to renewed reliance on out-of-school suspension and to exacerbate disparities in its use.
The authors would like to thank Gabriel Piña for his contributions to the data analysis.
Methodology Appendix
Related Research
© Copyright 2025 ChildTrendsPrivacy Statement
Newsletter SignupLinkedInYouTubeBlueskyInstagram


