
Data recently released by the U.S. Census Bureau demonstrate that poverty rates among families with children not only increased during the Great Recession but have declined only slightly five years after it ended.
A large body of research indicates that children who grow up poor—especially those who experience extreme poverty, early poverty, or long-lasting poverty—are more likely to have delayed cognitive development; poorer school performance, socio-emotional development, and physical health; and to be poor as adults. More recent research on the potential effect of family income on children’s brain structure and cognitive development is equally troubling, and highlights the need for an increased focus on identifying and implementing strategies for reducing poverty and ameliorating the negative effects of poverty on children’s development. On September 16, 2015, the U.S. Census Bureau released two complementary reports that highlight poverty statistics in 2014. One of the reports presents data based on the official poverty measure,[1] showing how the child poverty rate has fluctuated over the course of the Great Recession (December 2007 through June 2009) and in the period thereafter (see Figure 1). The other report presents data based on the supplemental poverty measure (SPM), which began being measured in 2010.
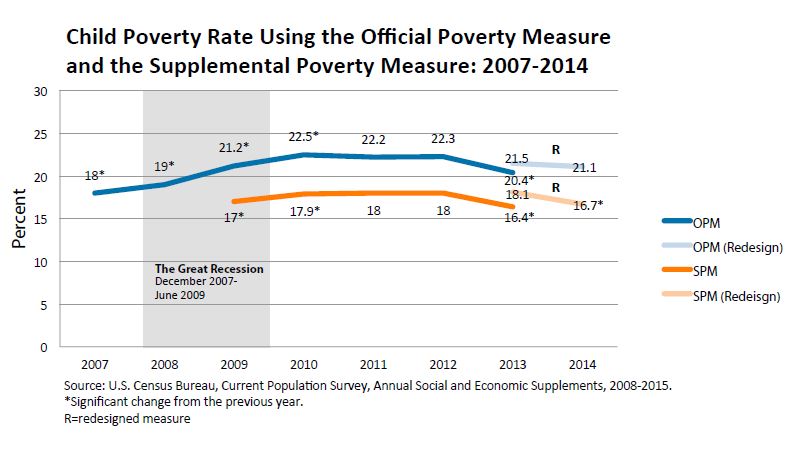
The SPM takes into account not only a family’s income, but also the cash value gained or lost by in-kind and cash benefits received through public assistance programs, tax credits, and out-of-pocket medical and work expenditures. Thus, some experts believe it provides a more accurate picture of families’ economic resources. As reflected in Figure 1, the child poverty rate is significantly lower when measured by the SPM, as compared to the official poverty measure. We can use both measures to look at trends since the last official year of the recession, 2009, the first year for which SPM data were reported.[2]
The official measure of child poverty during and after the Great Recession. Starting in the year prior to the recession until the year after it ended, the child poverty rate, as measured using the official poverty rate, increased each year, from 18 percent in 2007 to 22 percent in 2010 (see Figure 1). The rate began to stabilize about two years after the recession ended, remaining at just under 22 percent between 2011 and 2012, but did not decline (to 19.9) until 2013.
Comparing the 2013 and 2014 Census redesigned survey figures on child poverty, the difference in the percentage of children living in poverty between 2013 (21.5 percent) and 2014 (21.1 percent) was not statistically significant according to the official measure.[3]
The supplemental measure of child poverty in the aftermath of the Great Recession. Using the SPM yields a similar, though not identical, trend to that found using the official measure. After increasing from 17.3 percent in 2009 to 18.2 percent in 2010, the level of child poverty stabilized in 2011 and 2012, remaining at around 18 percent in both years. As was found under the official measure, child poverty decreased in 2013: the percentage of children living in poverty decreased from 18 percent in 2012 to 16.4 percent in 2013. As measured by the SPM, child poverty continued to decline in 2014, the most recent year for which data are available; incorporating the redesigned survey income measures, child poverty decreased from 18.1 percent in 2013 to 16.7 percent in 2014. The lower poverty rate found with the SPM indicates the effect of the programs and benefits assessed in the SPM in reducing the incidence of child poverty.
Five years after the recession ended, an economic recovery is underway, as indicated through slow but steady improvements in economic metrics such as the unemployment rate (currently at 5.1 percent after dropping from its peak of 10 percent in October 2009), and a high-performing, if inflated, stock market. However, the official child poverty rate, after increasing for four years before and during the recession, and then stabilizing and declining slightly in 2013, has not rebounded to its pre-recession levels. By this measure, more than 1 in 5 children remain in poverty, and by either measure—official or SPM—child poverty is too high.
Figure 1
[1] The official poverty measure varies by family income and composition; in 2014, the poverty threshold for a family of four with two children was $24,008.
[2] Although the Census Bureau released its first report publishing supplemental research poverty data in November 2011, that report provided information on poverty for both 2009 and 2010 for comparison purposes.
[3] The 2014 U.S. Census Bureau Current Population Survey, Annual Social and Economic Supplements used redesigned income questions which affected poverty data calculations for both the official measure and the SPM. In Figure 1, the separate trend lines (marked “R”) for 2013 and 2014 reflect the child poverty rates as calculated using the redesigned questions.
© Copyright 2025 ChildTrendsPrivacy Statement
Newsletter SignupLinkedInYouTubeBlueskyInstagram