Diligence and Reliability
Definition
Performing tasks with thoroughness and effort from start to finish where one can be counted on to follow through on commitments and responsibilities. (Diligence is often also used synonymously or grouped with: industriousness, perseverance, self-discipline, thoroughness, and working hard. While sometimes considered synonymous, it is often considered a subcategory of conscientiousness.)
- Working hard/with effort
- Perseverance/ Performing tasks with effort from start to finish
- Can be counted on
Parent Scale
How often…(None of the time, A little of the time, Some of the time, Most of the time, All of the time)
- does your child work harder than others his/her age?
- does your child do as little work as he/she can get away with?
- does your child finish the tasks he/she starts?
- does your child feel that it is hard for him/her to finish the tasks he/she starts?
- does your child give up when things get difficult?
- can people count on your child to get tasks done?
- does your child do what he/she says he/she is going to do?
Parent Scale Psychometric Properties and Fit Indices
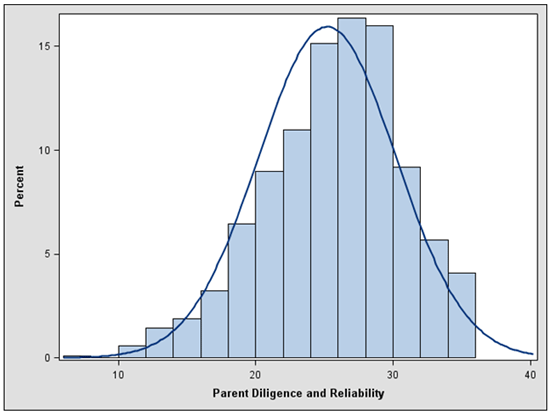
We conducted confirmatory factor analysis (CFA) to examine whether responses to the scale appeared to measure a single construct. Along with Cronbach’s alpha, we present model fit indices below.

- Alpha=0.89 (excellent)
- CFI=0.995 (excellent)
- TLI=0.986 (excellent)
- RMSEA=0.086 (marginal)
Adolescent Scale
Please indicate how often this happens (None of the time, A little of the time, Some of the time, Most of the time, All of the time).
-
do you work harder than others your age?
-
do you do as little work as you can get away with?
-
do you finish the tasks you start?
-
is it hard for you to finish the tasks you start?
-
do you give up when things get difficult?
-
can people count on you to get tasks done?
-
do you do the things that you say you are going to do?
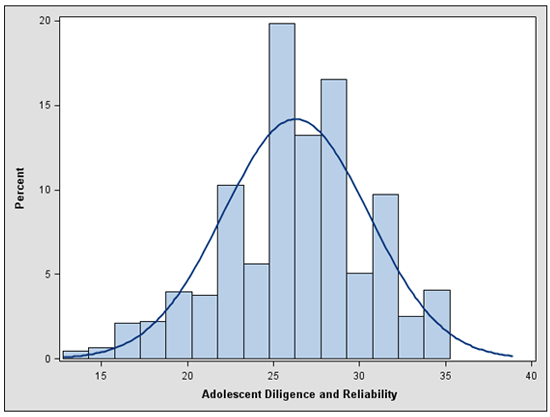
Adolescent Scale Psychometric Properties and Fit Indices

-
Alpha=0.79 (good)
-
CFI=0.994 (excellent)
-
TLI=0.983 (excellent)
-
RMSEA=0.069 (adequate)
Subgroup Model Fit
We tested the final adolescent and parent models with subgroups to examine whether the model fit for different subsets of respondents in the same manner as the overall sample. Using the same fit statistic requirements as the overall models, a check mark indicates that the model fit for the subgroup. Due to relatively small sample sizes and sparse categorical responses, resulting in too many bivariate empty cells, we were not able to fit all of the models. The subgroups for which we were not able to fit a model are indicated with N/A. Household income is defined as “low” if it is less than the median income in the sample. “High” household income indicates that the household income was equal to or greater than the sample’s median.

Concurrent Validity
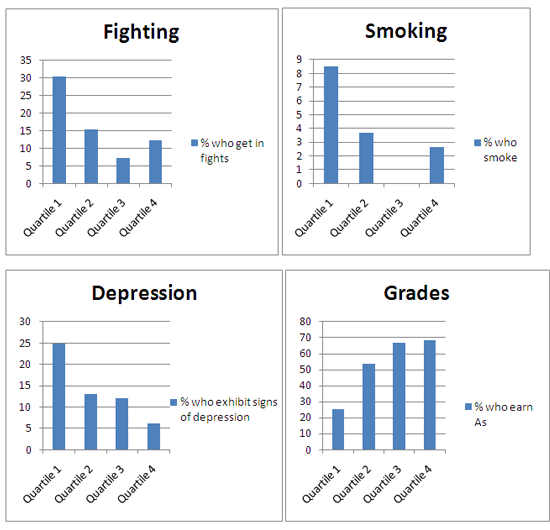
Four single item measures were used to examine the concurrent validity of the adolescent scale: a measure of social behavior (fighting), a measure of health behavior (smoking), a measure of emotional health (adolescent-reported depressive symptoms), and a measure of cognitive development (grades).
Concurrent validity was examined in two ways: with bivariate and multivariate analyses. The table below presents the results of multivariate analyses, which control for: teen gender, teen age, teen race, household income, household size, parental education, parental marital status, parental home ownership, parental employment, and metropolitan area and region of residence. The beta coefficient of the relationship between the construct’s scale and outcome is presented.

The graphs below show the bivariate relationships between the adolescent scale and outcomes. Results are presented for relationships that were at least moderately significant (at the 0.10 level) in the multivariate analyses. Note that the y axis scales are different in each graph.

© Copyright 2025 ChildTrendsPrivacy Statement
Newsletter SignupLinkedInYouTubeBlueskyInstagram